Every day, we see property for sale with either the owner or their agent touting it as a ‘great investment’ or ‘investor special’. The problem is that, more often than not, nobody every bothered to run the numbers to see if is, in fact, a great investment opportunity. So today, we’re taking on the task and looking at a couple of these ‘deals’ and walking you through our process of deciding whether it’s a winner or loser. Then we’ll wrap up by sharing some of our favorite tools to help you along the way.
* Register here to access the class presentation and our cliff-notes. They’ll be made available after the class!
Why THIS Class?
When I developed the idea for this class, it was hot on the heals of a day in which I received no fewer than 10 emails promoting new listings as great investment opportunities. And because at the time I was actively searching for our next investment property, I would always run the numbers based on their list price and what I know my particular buy box to be. And when I ran the numbers, no investor in their right minds would have considered those properties a ‘great investment’.
So.. just to test my theory, I searched the MLS for properties in which the listing agent used the word ‘invest’ in the public remarks. That way I would catch all the properties that used the usual terms – ‘investor special’, ‘would make a great investment’, ‘investors STOP’… you know, the usual.
What I found was 142 homes active on the market. So I picked 10 of them at random, each in a gradually increased price range. And what I found, to me, wasn’t particularly surprising; those ten properties averaged the following:
None of these number, at least to me, were anything to be excited about.
What is your Buy Box?
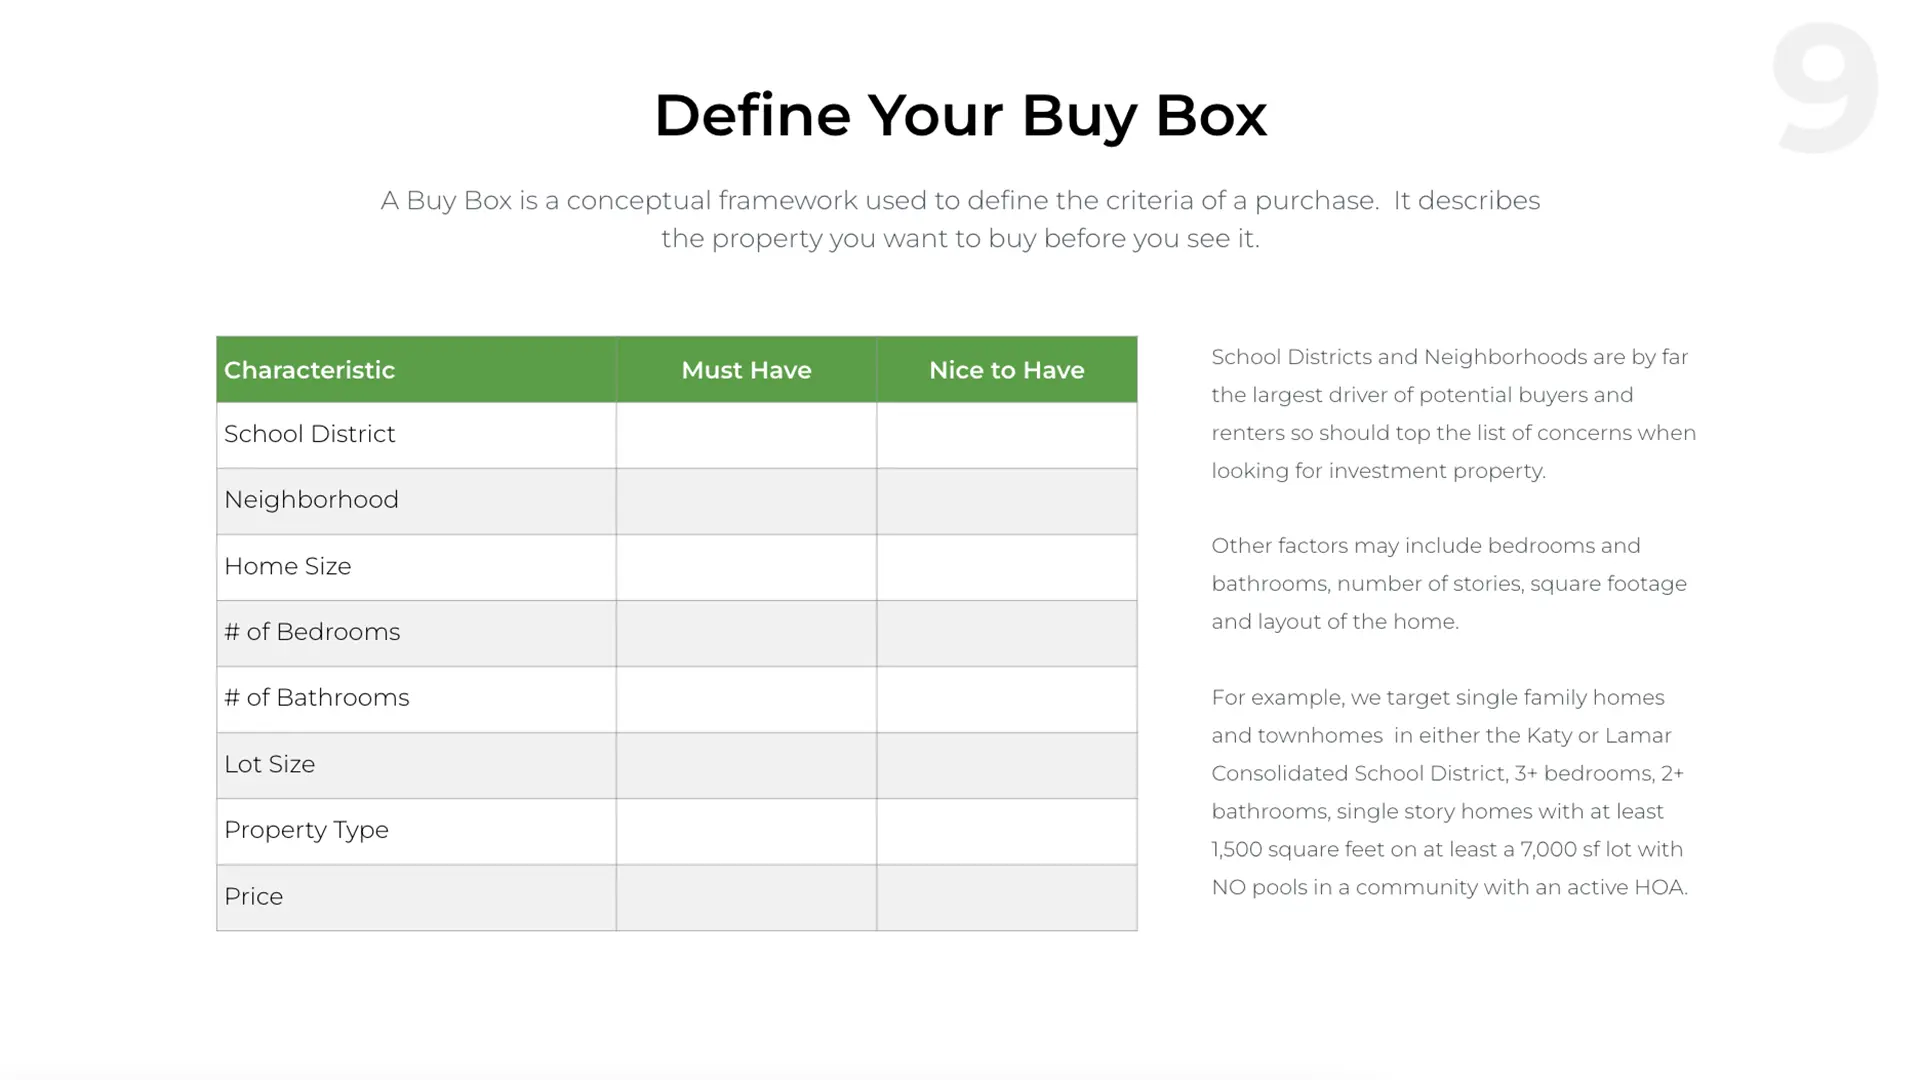
So what exactly is a Buy Box? Before we go through the hassle of determining if a given property is a good opportunity, we need to make sure to weed out the properties that we have no interest in. Many investors return to this targeting as establishing a Buy Box. A Buy Box is a conceptual framework used to define the criteria of your purchase. It describes the property you want to buy before you see it.
What does a Buy Box look like?

School Districts and Neighborhoods are by far the largest driver of potential buyers and renters so should top the list of concerns when looking for investment property. Other factors may include bedrooms and bathrooms, number of stories, square footage and layout of the home.
For example, we target single family homes and townhomes in either the Katy or Lamar Consolidated School District, 3+ bedrooms, 2+ bathrooms, single story homes with at least 1,500 square feet on at least a 7,000 sf lot with NO pools in a community with an active HOA.
Lastly, price, loan eligibility, and local demand can drive investment decisions. And understand how all these factors work together to make a smart decision. After all, even if you find your perfect house, at a great price with the best financing – it won’t make a difference if there’s no rental demand in the area and declining population numbers.
Understand KPI’s
Key performance indicators will create a financial snapshot of how your investments are performing at any given time. We’re going to look at some of the big ones: NOI, Cap Rate, Cash Flow, ROI, and OER and then try to define what kind of numbers we should be looking for. For the purposes of illustration, we’re going to use the following figures to calculate our KPI’s:
NOI (Net Operating Income)
Net operating income (NOI) is a calculation used to analyze the profitability of income-generating real estate investments. NOI equals all revenue from the property, minus all reasonably necessary operating expenses. It’s important to understand when calculating operating expenses for NOI, debt service (mortgage), depreciation, and capital expenditures (improvements and additions) are not included.
So here’s what the calculation for NOI looks like:
| Total Revenue (Rents + Other Revenue) |
| – Total Operating Expenses |
| = NOI (Net Operating Income) |
So using the figures above for our fictional investment opportunity, our Net Operating Income would look like the following. Understand though that this is a very simplistic example that doesn’t include repair, management, capital expenditures reserves, etc.
| $21,600 ($1,800/month in rent x 12) |
| – $6,000 (Annual Taxes + Annual Interest) |
| = $15,600 |
Cap Rate
A cap rate is the annual return from operations that an investor would expect to receive for a certain asset in a specific market at the current time IF the asset were to be purchased for all cash. Or in order words, a snapshot of expected performance for an asset that is purchased for cash.
How to Calculate Rap Rate:
| Cap Rate = Net Operating Income / Current Market Value or 7.8% = $15,600 / $200,000 |
But wait… that’s not all. You can also turn this formula around to calculate other variables. Want to know what you should pay for a property?
| Value = Net Operating Income / Cap Rate or $200,000 = $15,600 / 7.8% |
And in the immortal words of Steve Jobs… just one more thing. What is you want an estimate of what your net income will be:
| Value x Cap Rate = Net Operating Income or $200,000 x 7.8% = $15,6000 |
Cash Flow
For real estate investors, cash flow is the income left after paying out expenses such as the mortgage, taxes, insurance, vacancies, repairs, capital expenditures, utilities and any other expenses that affect the property. A property’s cash flow is calculated by subtracting the total expenses from the total income. This can be done on a monthly or annual basis. This differs from calculating net operating income because cash flow takes into account debt service and capital expenditures.
How to Calculate Cash Flow:
| Total Income |
| – Total Expenses |
| – Principle & Interest |
| – Capital Expenditures |
| = Cash Flow |
| $21,600 ($1,800 / month in rent x 12) |
| – $6,000 (Annual Taxes + Insurance) |
| – $11,508 (Annual Principle + Interest) |
| – $0 (No Capital Expenditures for this example) |
| = $4,092 ($341 / month) |
How much a property cash flows is purely subjective as what one investor might consider acceptable will be nothing like what another will. Consider what capital expenditures can quickly do to cash flow and save accordingly.
ROI (Return on Investment)
Return on investment (ROI) measures how much money or net profit is made on an investment, displayed as a percentage of the cost of that investment. It shows how effectively and efficiently investment dollars are being used to generate a net profit. And the calculation looks a little different depending on whether you use cash or financing to purchase the property.
How to Calculate for Cash Transactions:
| ROI = Annual Return (Annual Rents – Expenses) / Purchase Price + Closing Costs + Remodeling or 7.26% = $15,600 / $215,000 |
How to Calculate for Financed Transactions:
The calculation for financed transactions takes into account your down payment (out of pocket costs) rather than the entirety of the purchase price.
| ROI = Annual Return (Annual Rents – Expenses) / Down Payment + Closing Costs + Remodeling or 7.44% = $4,092 / $55,000 |
OER (Operating Expense Ratio)
The operating expense ratio (OER) is a measure of your property’s financial efficiency and shows how much you spend to generate income.
In real estate, the operating expense ratio (OER) is a measurement of the cost to operate a piece of property, compared to the income brought in by the property. It is calculated by dividing a property’s operating expense by its total revenue.
Optimally, you’ll want to try to keep your OER under 50%, which plays into the idea of keeping your revenues up and your expenses down.
How to Calculate OER:
| OER = Total Operating Costs / Total Revenue or 28% = $6,000 / $21,600 |
Cash vs. Finance
Nicole LeBoeuf with AMP Lending join us to talk about the differences in buying your next investment property using cash or financing it.
You can reach Nicole at nleboeuf@askmortgagepros.com or 281-391-5363.

Get a presentation of Nicole’s available investment products here.
Evaluating the Deal
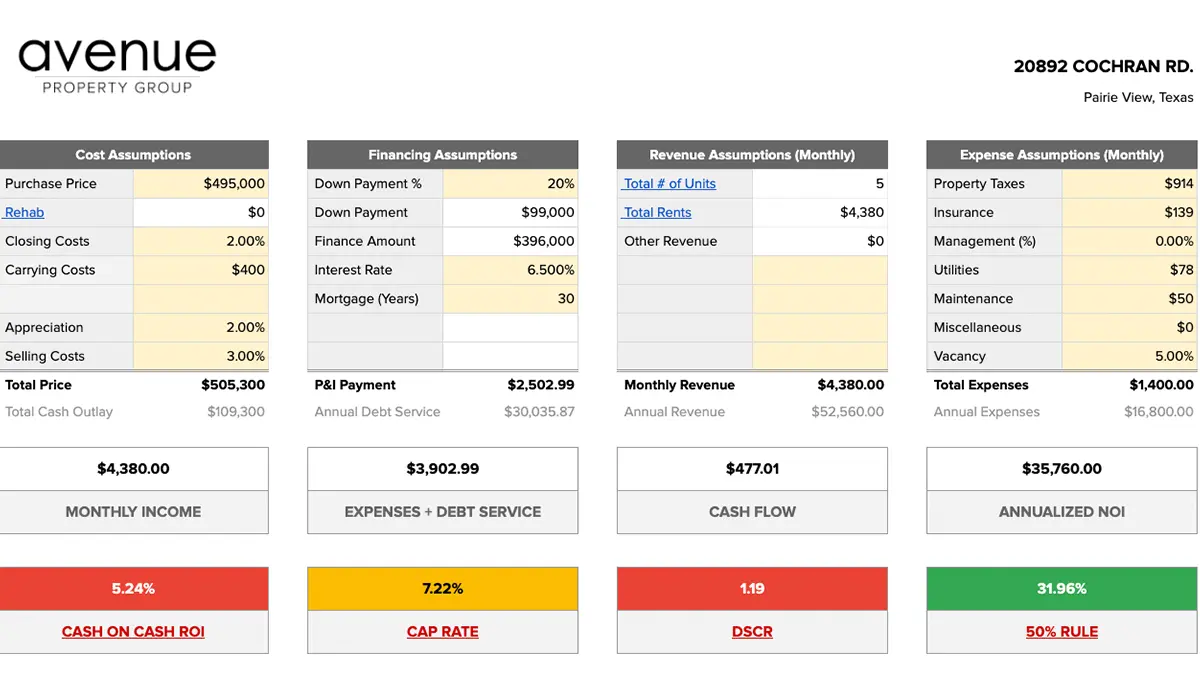
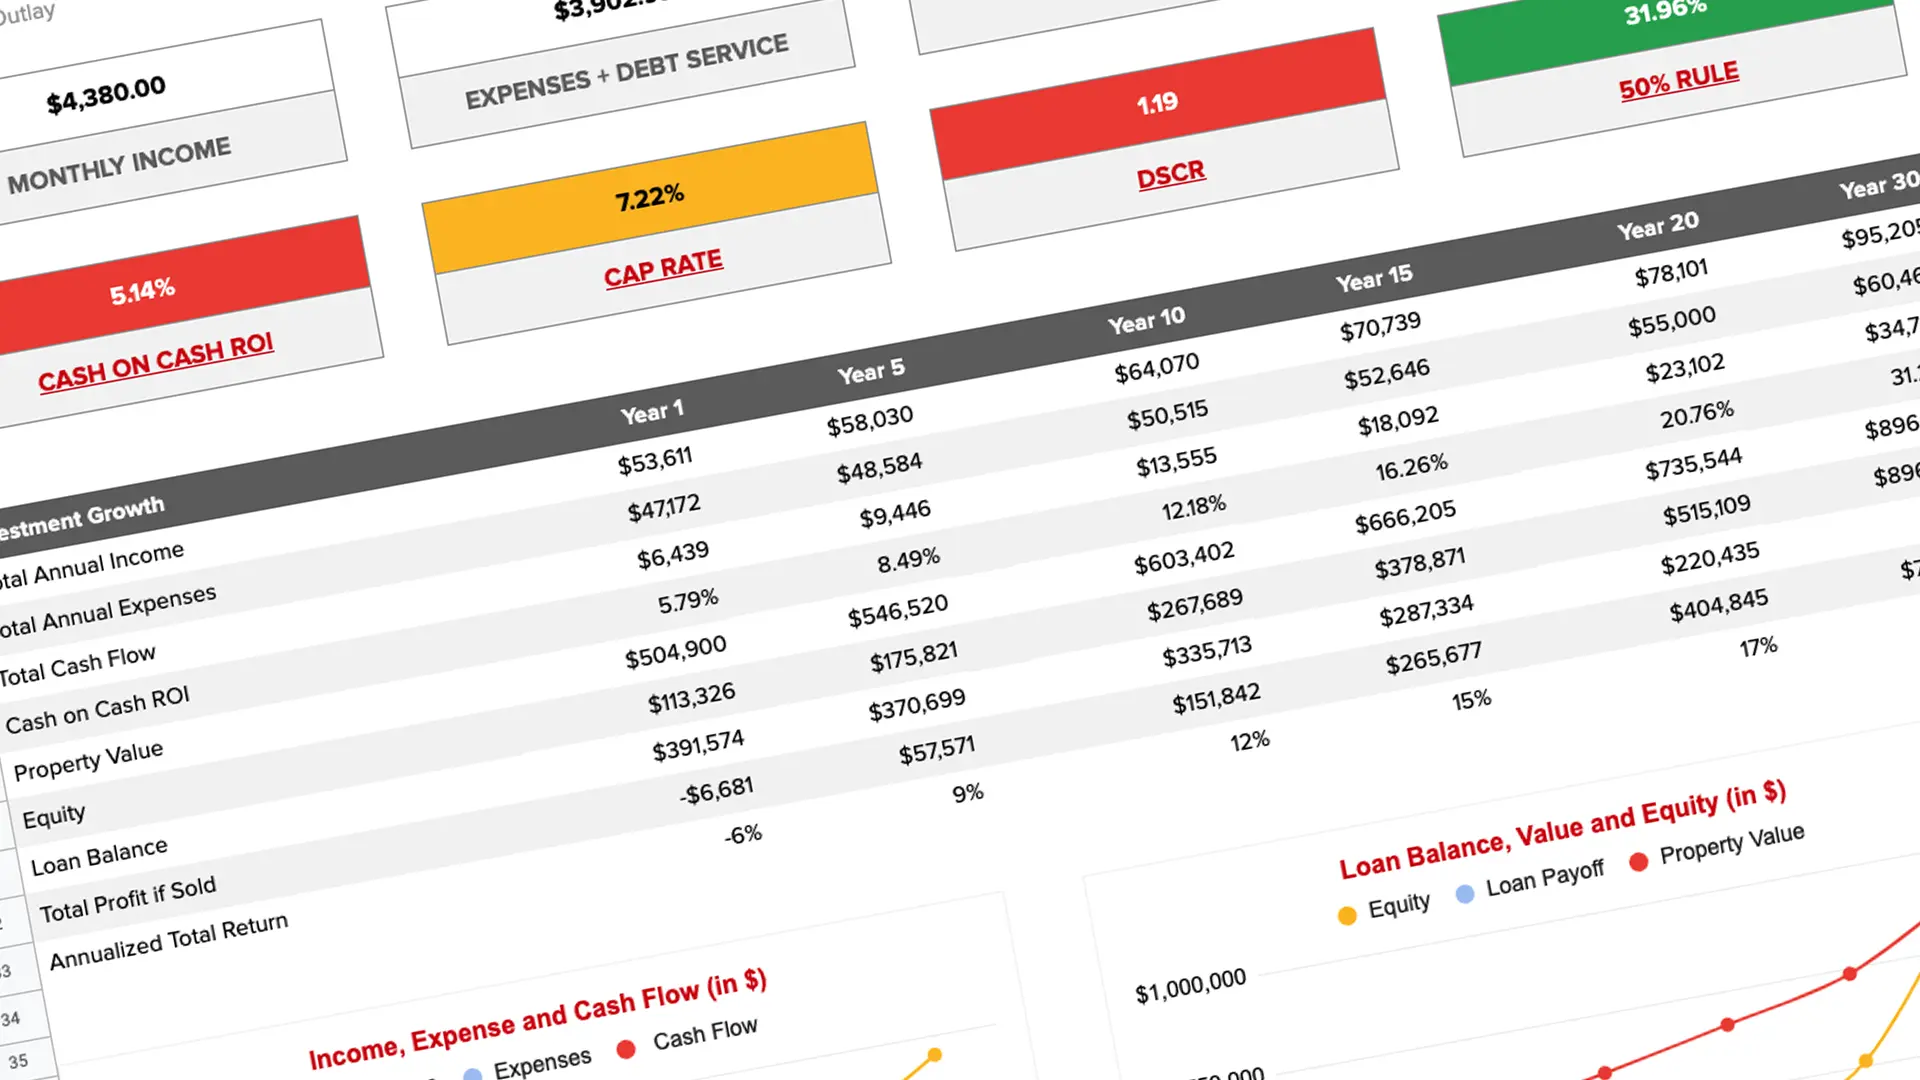
In this section of the class, we dropped out of the presentation and worked through a live example of using Avenue Property Group’s Investment Analysis Worksheet, which is linked below.

Useful Tools
Investment Analysis Worksheet
Download your very own copy of our Investment Analysis Worksheet, then customize it and use for your own business.
BallParkDeal
For quick and dirty calculations on the go that don’t need to be printed or shared, this is a FREE app available for your mobile devices.
IgniteRE
First American Title has been working hard to provide research tools and calculators to make our businesses simpler. Contact your favorite First American title representative for more. In our area, that’s Brandye Foster.
ReMine
Remine is another research tool that is available free to members of the Houston Association of Realtors. It has a great marketing piece as well.
Stessa
Once you have rental properties, you’ll want a simple way to manage them. Stessa (Assets spelled backwards) is one of the best.
Innago
An alternative to Stessa, Innago also has built in tenant screening, lease management, and repair management tools built right in.


